Reading the Billing & Sales Report
The Billing & Sales Report is the one report you should learn to read fluently. It is the most honest single view of how your business is doing this month, this quarter, this year. Everything else — aging, statements, tax filings — is downstream of the data you see here.
The trouble is that "revenue" is not one number. It's at least three numbers, and they will not agree with each other. This article is about understanding why they don't, and which one to look at when.
When you'd use this
- Closing the books at the end of the month and you want to know what actually shipped.
- A bookkeeper or accountant is asking what your sales were for a period.
- You're trying to figure out whether margin is healthy on a particular service category.
- You want to spot-check whether a slow week was actually slow, or just felt slow.
- You're preparing a year-over-year comparison.
If you only want to know "who owes me money right now," that is the aging report, not this one.
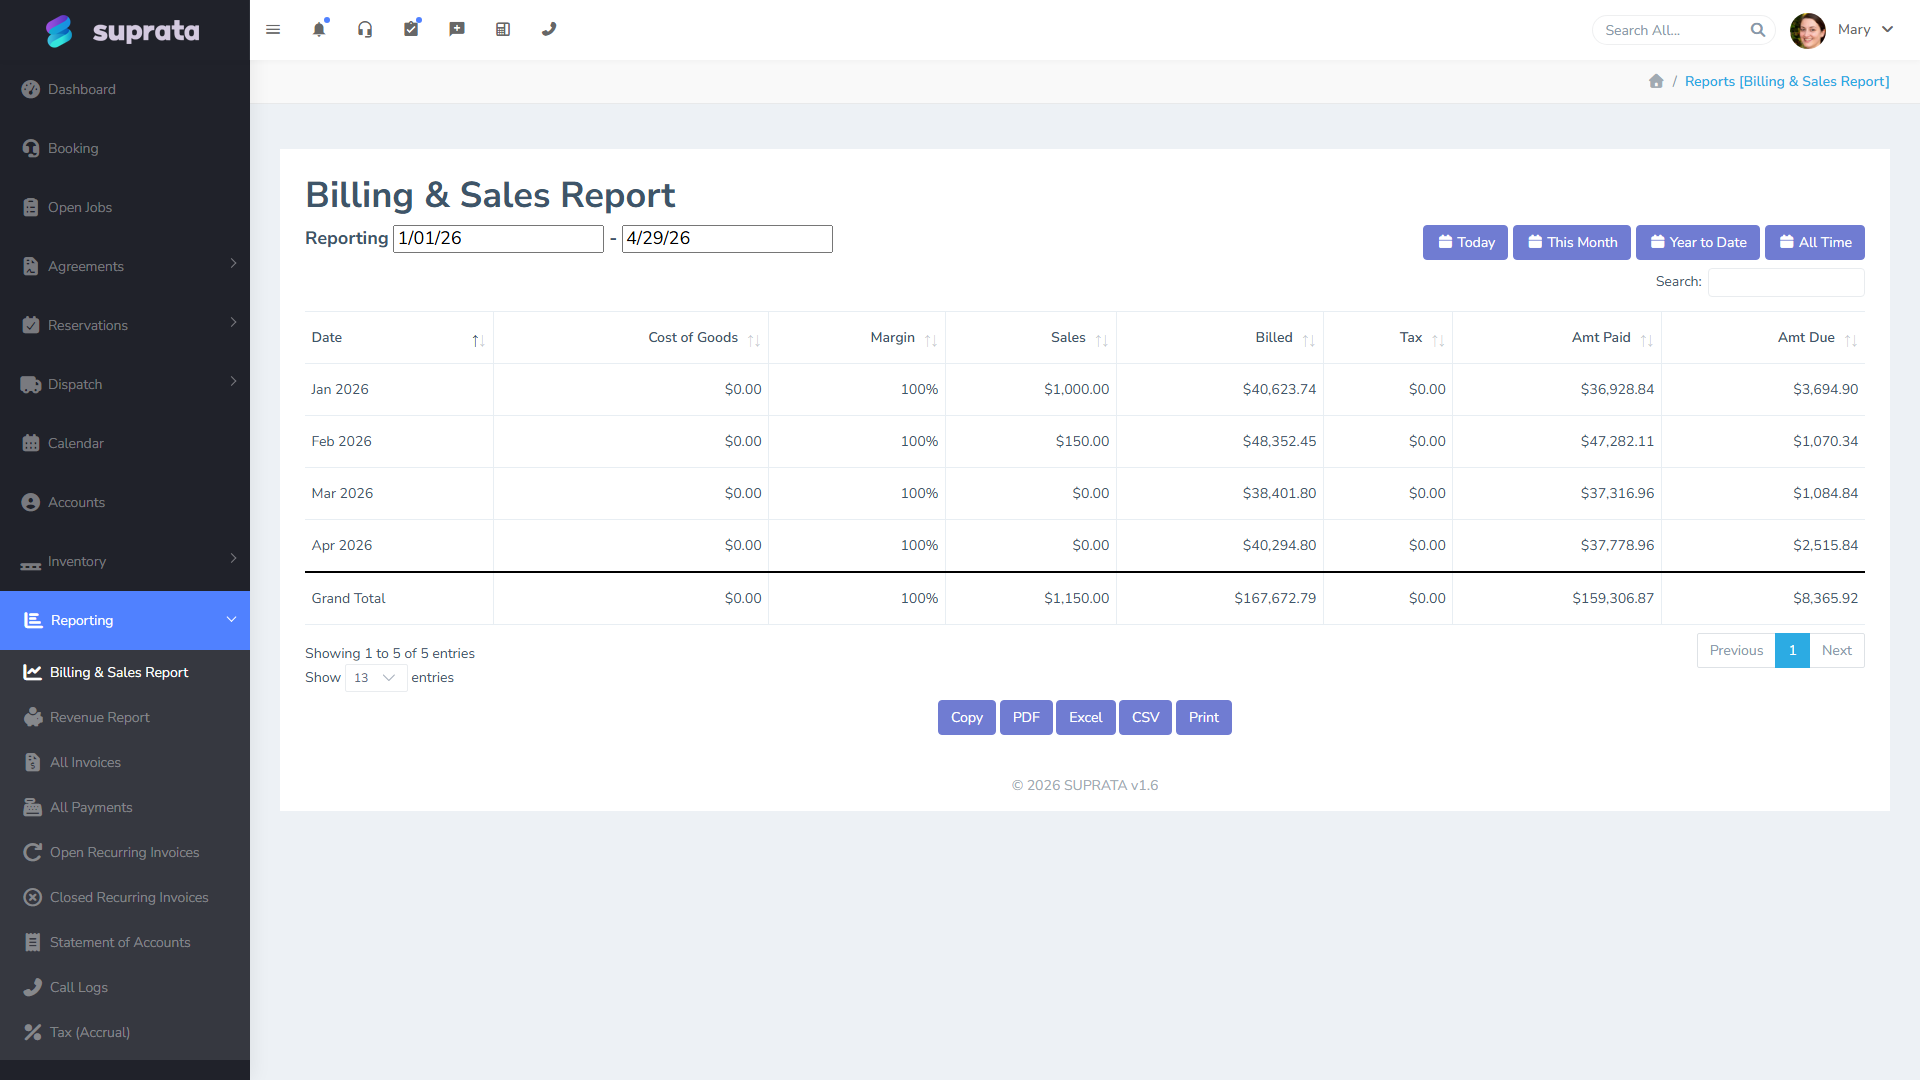
The four numbers and why they differ
Every row on the Billing & Sales Report shows the same period sliced four ways. They mean different things and you need all four:
- Sales — line-item dollars on invoices created in the period, before tax. This is your top-line revenue. It moves with what you priced and sold.
- Billed — total dollars invoiced (sales + tax). This is what showed up on customers' invoices.
- Paid — money that actually arrived in the period. Cash basis. This is what your bank saw.
- Due — the remaining unpaid balance from invoices in the period. Sales minus collections, roughly.
If your sales were $48,000 in March but paid was only $31,000, that's not a problem on its face — it just means $17,000 of work invoiced in March will collect in April or beyond. It becomes a problem if that pattern persists for several months and the gap keeps widening. That's a collections problem, and you'll see it on the aging report.
Margin is the other column to pay attention to. Margin is sales minus the cost-of-goods-sold from the price list. Items in the price list carry both a sell price and a cost; margin is computed line-by-line and rolled up. If margin looks wrong, the most common cause is items in the price list with no cost set — they show 100% margin and bias your average up.
Date filtering — read this before you trust the numbers
The report defaults to a sensible range, but the moment you change it you have a decision to make: are you filtering by invoice date or by payment date? They're not the same.
- Invoice date answers "what did we sell in this period?" Use this for sales analysis, year-over-year comparisons, and anything tax-related.
- Payment date answers "what cash hit our account in this period?" Use this for cash-flow analysis and reconciling against bank deposits.
Most businesses care about invoice-date sales the majority of the time. Cash-basis businesses (and certain tax filings) care about payment date. If you're not sure which mode you're looking at, look at the column headers and the date selector — the report makes it explicit, but it's easy to miss while scanning.
A common mistake: pulling a report for "last quarter" while in payment-date mode and being confused that it includes payments for invoices from two quarters ago. That is the report telling you the truth — those payments hit last quarter — but it's not what you wanted if you were asking the sales question.
Reading a typical month
Take a representative row. Suppose March shows sales $48,200, billed $51,500, paid $31,400, due $20,100, margin 38%.
- Sales of $48,200 is your top-line. That's the work you closed.
- Billed of $51,500 is sales + tax. The $3,300 difference is the tax you collected on behalf of the state. That money is not yours; it's a liability you'll remit on the schedule from your tax reports.
- Paid $31,400 means that's what actually showed up in your bank from invoices created in March. Some of that may have been paid in April but it counts here because the invoice was March.
- Due $20,100 is the unpaid March invoices — they'll either collect in April/May or age into the aging buckets.
- Margin 38% on $48,200 sales means cost-of-goods was about $29,900, gross profit ~$18,300. Whether 38% is good depends entirely on your industry — service-heavy businesses run higher, parts-heavy businesses run lower.
If any one of those numbers looks off by more than 10% compared with your normal month, dig in now. A mispriced item, an under-billed agreement, or a collection problem is much easier to fix the week it starts than the quarter you finally notice it.
How to use it weekly versus monthly
Weekly: glance at the week-to-date row. Is sales tracking with where last week was at the same point? If you're 30% behind by Wednesday, you have a slow week and you can react — push outbound, check whether dispatch is sitting on appointments, look at why estimates aren't converting.
Monthly: do the four-number read. If sales and margin are healthy but paid is lagging, the problem is collections, not sales. If sales are healthy but margin is dropping, the problem is pricing or item costs, not volume. Each diagnosis points to a different fix.
Quarterly / yearly: this report is the input to almost every other view of the business. Print it, save it, compare it to the same quarter last year. The pattern will tell you whether the business is growing, drifting, or contracting.
Common mistakes
- Treating "billed" as revenue. Billed includes sales tax, which isn't yours. For revenue, use the sales column.
- Comparing payment-date and invoice-date numbers without realizing it. Always check which mode the report is in before drawing conclusions, especially when you reopen the report a few days later.
- Ignoring margin because it looks "off." If margin shows numbers that are wildly higher than reality, the cause is almost always missing item costs in the price list. Fix the price list first; the report will then become trustworthy. Don't conclude the report is broken — conclude your catalog is incomplete.
- Reading the year-to-date column as "what we earned." YTD sales is what you invoiced. YTD paid is what arrived. They're different, especially in fast-growing businesses where invoicing outruns collections.
- Pulling the report once a month and only then. Glance at it weekly. Catching a mispriced item or a slow-paying customer pattern in week two is much easier to fix than catching it three months later.
- Not filtering by business unit when you have multiple. If you operate more than one brand under one Suprata account, the unfiltered report mixes them. Filter to one unit at a time when you're trying to assess that line of business specifically.
Related articles
- The aging report — knowing who to chase first
- Statement of account — what to send a customer
- Tax reports — what goes where on your state filing
- (Once "Building a custom dashboard" is written, link to it here.)